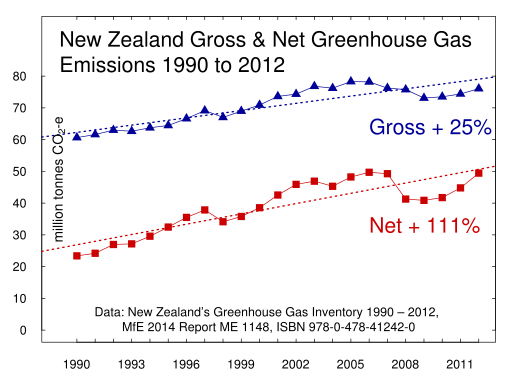
I have just prepared and revised a graph of New Zealand's gross and net greenhouse gas emissions for the years 1990 to 2012. I have recycled the style of the graph of gross emissions from 1861 to 2012.

I have used html code from the scalable vector graphic I uploaded to Wikipedia Commons and not the Blogger template. I think it gives a better quality graphic.
The data is from Ministry for the Environment publication New Zealand’s Greenhouse Gas Inventory 1990 – 2012, Report ME 1148, ISBN 978-0-478-41242-0, April 2014.
The data and R programming language script are available at Wikimedia Commons.

No comments:
Post a Comment