Showing posts with label unit allocation. Show all posts

15 March 2017

New Zealand Aluminium Smelters Ltd and their excessive free allocations of emission units

This post is sort of a 'review article' post synthesizing all my previous posts about New Zealand Aluminium Smelters Limited and how their overly generous free allocation of emission units under the emissions trading scheme shields them from a carbon price. NB also posted at Robin Johnson's Economics Web page..

In each year that New Zealand has had an emissions trading scheme, the trans-national company New Zealand Aluminium Smelters Limited was given a very generous 'free allocation' of emission units. First, back in 2010, and in the years following and, bringing us up to date, in 2015.

I have written several blog posts about these free allocations. In the very beginning, back on 7 October 2011, I wrote 150% Pure Subsidy which was also posted at Hot Topic as 120% Pure Subsidy.

In that post I argued that New Zealand Aluminium Smelters Limited, the operator of the Tiwai Point aluminium smelter, was being 'over-allocated' emission units under the New Zealand Emissions Trading Scheme (the "ETS"). That the company was being given more free emission units than the emission units it was required to surrender for it's emissions. And therefore the company was not 'facing a carbon price' under the emissions trading scheme. It was being shielded from the carbon price. In other words, the allocation of free emissions units acted as an 'insurance policy' against ever facing a carbon price.

The company was given an industrial allocation of 210,421 units for the six months from 1 July to 31 December 2010. I estimated that the smelter company was required to surrender between 143,000 and 172,000 emissions units for the six months to 31 December 2010. Therefore the estimated degree of over-allocation of units was between 120% and 147%.

The over allocation is obvious, I thought, when we compare the emissions factor (as used in our greenhouse gas inventories) of producing a tonne of aluminium, with the allocation 'baseline', the number of emission units allocated per tonne of aluminium produced.

In the CRF tables/spreadsheets (20MB zip file) released with New Zealand's Greenhouse Gas Inventory 1990–2014, the 2010 emissions factor for producing a tonne of aluminium is 1.67 tonnes of carbon dioxide with an additional 0.14 tonnes of carbon dioxide equivalent for perfluorocarbon (PFC).

In October 2011, the Climate Change (Eligible Industrial Activities) Regulations 2010 specified that New Zealand Aluminium Smelters Limited was allocated 2.556 emission units per tonne of aluminium produced in 2010.

That allocation 'baseline', 2.556 units per tonne of production, exceeded the 'inventory' emissions factor in carbon dioxide equivalent (1.67 + 0.14 = 1.81) by a factor of 1.4. As indicated in this bar chart, which you could say represents a mental model of how the free allocation works.

Then, on 20 October 2011, I wrote 120% Pure Subsidy: Part 2 which was also cross-posted at Hot Topic.

In that post, I was given feedback that the free allocation of units to emitting industries included extra units for "ETS electricity pass-through costs".

As the report "Development of industrial allocation regulations under the New Zealand emissions trading scheme: Consultation document, (MfE December 2009, ME 984) stated;

"A number of energy-intensive firms will face higher costs of production because of the electricity used in their production"
because, Q.E.D.
"The NZ ETS will increase the costs of generating electricity from fossil fuels and geothermal sources".

This was also explicit in the original Labour Government report "The Framework for a New Zealand Emissions Trading Scheme" of 2007.

It stated in the fourth bullet point to subsection '5.3.1 In-principle decision on levels of assistance through free allocation' (with my underlining), that;

indirect emissions associated with the consumption of electricity, as well as direct emissions from ... industrial processes will be included in the concept of emissions from industrial producers ... The basis for allocation for electricity consumption will be one that compensates firms for the cost impact”.

However, the total free allocation for both direct emissions and the 'ETS electricity pass-through costs' "would operate within a total envelope of assistance to industry defined as 90 per cent of 2005 emission levels", (subsection 6.5.2.1 Free allocation Level of total assistance to industry).

This allocation 'envelope' (almost a 'cap') of 90 percent of 2005 emissions was dropped in the 2010 Cabinet Paper "EGI Min (10) 14/9".

For highly emissions-intensive trade-exposed emitters, the allocations would be based on actual production (i.e. an 'intensity' basis where allocation would increase if production increased) for the industry (Paragraph 14). The 90 percent (of historic emissions) became a "90% level of assistance" (Paragraph 20) which then became an input to the formula for calculating the allocation number; 'Allocation (in units) = Level of Assistance × Quantity of Production × Allocative Baseline' (Paragraph 32).

The 2010 Cabinet Paper "EGI Min (10) 14/9" established a proxy for the 'ETS electricity pass-through costs', the electricity allocation factor (to calculate ‘emissions’ per megawatt hour of electricity used, paragraph 8) as stated in paragraph 37:

An electricity allocation factor of 0.52 tCO2-e/MWh has been used to calculate proposed allocative baselines. This was the factor proposed in 2008 by the Stationary Energy and Industrial Process Technical Advisory Group (SEIP TAG) to offset the expected increase in electricity price as a result of the introduction of the NZ ETS. This factor was intended to reflect increases in electricity price to the end of 2012 and will need to be periodically updated.

So the counter argument is that New Zealand Aluminium Smelters Limited faces a carbon price through increased electricity costs rather than through the number of emission units surrendered for it's direct emissions.

We may say the allocation baseline has two parts; a direct emissions baseline and and an electricity/(energy) baseline. The free allocation of additional units for the ETS electricity costs lessens the impact of that carbon price (without removing it entirely). This bar chart, where the allocation baseline is less than the sum of the various emissions costs, is the mental model for this narrative for the free allocation.

However, the bar chart isn't the last word. I just made up the numbers to show the idea.

Free allocation to the smelter includes ETS electricity costs. What could possibly go wrong?

Back in the mid-2000s, when the ETS was being developed, what else did we know about the New Zealand Aluminium Smelters Limited electricity contract with Meridian?

We knew it was secret, controversial and far too cheap. Brian Fallow in 2004 estimated the electricity price to be just over 5c a kilowatt hour. Another 2008 cost estimate was $52-$54 a MWh (5.2c - 5.4c a kilowatt hour. CAFCA thought the cost in 2007 was 4.7 c a kilowatt hour.

Brian Fallow also points out the pre-2013 contract exposed perhaps 10 per cent of the supply to the floating wholesale price and that New Zealand Aluminium Smelters were very sensitive about varying wholesale costs when the hydro lakes had low storage levels.

The design of the generous free allocation regime moved the 'discounted' (but apparently still real) ETS 'carbon' price away from the direct emissions and to the ETS electricity pass through costs of an aggressive transnational company with the largest volume, cheapest and most secretive electricity contract in New Zealand. It would be harder to think of a policy more likely to result in regulatory capture (See Internet Archive) and rent-seeking.

The fact that unit allocations include indirect energy costs may make emitters net sellers of units

There is one other important implication of upstream (ETS-related) energy costs being included in the 'allocation baseline'. The total allocation may well be greater than 100% of their direct emissions. But that doesn't matter if the emitter still faces some reduced electricity ETS cost pass-through.

The big 'emission intensive' and 'trade exposed' emitters will always be net sellers of emission units. It very hard to see how a net seller of emission units is, as Nick Smith liked to say, "facing a carbon price".

As an example, there wasn't much doubt that New Zealand Steel's direct allocation of units exceeded their emissions liability.

As Jan Wright observed in her submission on the electricity allocation factor:

"The pertinent question, then, is how much electricity prices will increase as a result of carbon pricing. But electricity price increases are very hard to predict, due to the complexities of the New Zealand electricity market and the need to cater for rising electricity demand. Despite the difficulty, it is imperative the number of credits given to industry to offset electricity price increases should be accurately - and transparently - determined."

The critical questions are therefore "What are the extra costs to the smelter of thermally generated electricity caused specifically by the emissions trading scheme? How are these extra costs measured? Are the costs and method of measurement transparently disclosed?"

It's not classic cap and trade its a double-dip

Let's just be very clear that this idea of the allocation base including upstream ETS energy costs is conceptually a departure from the classic 'cap and trade' model of emissions trading. In strict cap and trade, with a real cap on emissions, and with 'grand-parented' free allocation of the 'capped' units to emitters, the energy sector would be allocated a share of the cap to reflect their direct emissions from energy generation. That allocation, being a part of the finite cap, could not go to both the energy companies with thermal fossil-fuel generation and to the 'downstream' industrial emitters.

In other words, the allocation of extra units to industries because of additional 'up-stream' carbon-intensive energy costs caused by the emissions trading scheme, is the allocation that would have gone to the energy companies in the classic model. That would not be possible in true 'all-sectors' emissions trading scheme with a real cap. It's only possible in our emissions trading scheme because it only applies to parts of the economy and as it is uncapped.

But lets get back to the issue of the 'ETS electricity pass-through costs'. At the time of 120% Pure Subsidy: Part 2 I argued that it was a nonsense for the free allocation of units to a smelter to include a compensation factor for upstream carbon-intensive electricity costs, when that smelter owed it's existence to a dedicated source of hydroelectric generation from Lake Manapōuri. Also the generator the smelter contracts it's electricity from is the 100% renewable Meridian Energy.

The counter argument is that that the contract (or contracts) with Meridian prices some proportion of the electricity supplied at the whatever the wholesale price is at a point in time. And as explained by Brian Fallow, the wholesale price may include an ETS component when coal generation is setting the marginal price.

Then, on 2 November 2011, I wrote Nick Smith fails the smelter spin test, also cross-posted at Hot Topic.

In that post, I argued that the then Minister for Climate Change Issues Nick Smith was incorrect in saying that New Zealand Aluminium Smelters faced a carbon price and that European aluminium smelters did not. Even though the European smelters were not (at that time) participants in the European emissions trading system, the (upstream) electricity sector was and therefore there was a carbon price passed 'downstream' to the smelters from the more carbon-intensive European electricity generators.

On 23 April 2012, I reported that New Zealand Aluminium Smelters Limited had won the 2011 Roger Award for being the worst transnational company operating in New Zealand.

On 9 September 2012, I wrote Power to the smelter? New Zealand Aluminium Smelters Limited wants to pay less for electricity for the Tiwai Point aluminium smelter. That post noted that New Zealand Aluminium Smelters Limited was renegotiating the electricity supply contract with Meridian Energy.

I concluded that New Zealand Aluminium Smelter Limited had breathtaking audacity in threatening to close the Tiwai Point Smelter if they didn't get lower electricity costs, when they already enjoyed the lowest electricity cost of any sector in New Zealand. In 2011 New Zealand Aluminium Smelter Limited paid the very lowest average rate for electricity in New Zealand; 5.03 cents per kilowatt-hour! Residential users paid 22.6 cents per kilowatt-hour, or four times as much.

On 11 September 2012, I riffed off a gangster meme and wrote the evocatively-titled Rio Tinto Alcan New Zealand Ltd plays godfather: nice aluminium smelter you got, be a shame if something happened to it, also at Hot Topic.

I noted that New Zealand Aluminium Smelter Limited was again threatening to close the smelter and in effect saying "Shame if something happens to" the smelter workforce, the Southland economy, the New Zealand electricity market, Meridian Energy and the conservation program for the critically endangered kakapo.

For a couple of years, I didn't really think about smelter until I looked at the Official Information Act releases by the NZ Treasury about the New Zealand Government's payment of $30 million to New Zealand Aluminium Smelters Limited in 2013.

Amongst the dozens of documents was an email between officials with a familiar title which made me laugh; Email to Officials: Rio Tinto Alcan NZ Plays Godfather: Nice Aluminium Smelter you got, be a shame if something happened to it.

In this email, one official noted to another that Meridian Chief Executive Mark Binns had emailed them asking if the electricity costs mentioned in my Hot Topic blog post were correct and that yes the numbers were correct!

Another couple of years went by. As they tend to. Then, on 9 April 2016 of this year, I wrote Opening up the data on emissions units in the NZ emissions trading scheme. In that post I noted with some surprise that the updated data on free emissions unit allocations showed that New Zealand Aluminium Smelter's 2013 allocation had increased by a factor of five from the 2012 allocation. And of course I made a bar chart.

So what happened in 2013? The free allocation increased from 301,244 units in 2012 to 1,524,172 units.

What happened was that the 2013 allocative baseline for aluminium production changed from 2.062 units per tonne to 10.441 units per tonne. As you can see from this bar chart.

Wrapping it all up

In hindsight, it's obvious from the June 2010 Cabinet paper Industrial Allocation under the New Zealand Emissions Trading Scheme: Group One Activities, Ref no: EGI Min (10) 14/9 that although there was a generic 'electricity allocation factor' of of 0.52 tCO2-e/MWh, that would not apply to New Zealand Aluminium Smelters Limited.

They would instead have a 'bespoke' arrangement for the electricity component of the allocation baseline.

This apparently involves an annual "reading" of the highly confidential ultra-cheap electricity supply contract with Meridian. There are a number of potentially ambiguous statements about how this is done.

Paragraph 38 states;

"Specific electricity supply arrangements mean it is appropriate to prescribe specific allocative baselines for aluminium smelting. The Act contains the ability to adjust allocative baselines where particular electricity supply arrangements affect the electricity price increase a particular firm faces. The rationale for this power is to prevent large over-allocations where electricity related contracts prevent a full pass-through of electricity costs."

Paragraphs 40 is in first-person and active tense (think of Nick Smith speaking confidently) and it states (with my underlining)

"I have since used my powers under section 161D of the Act to request electricity contracts and related information from NZAS. [Deleted] In particular the analysis suggests:
  1. An average pass-through of electricity costs to NZAS during the transition phase (until 2013) of [Deleted] compared with the pass through of 0.52 tCO2-e/MWh that would otherwise be assumed.
  2. Using the default pass-through of 0.52 tCO2-e/MWh would result in an average over-allocation to NZAS of [Deleted] during the transition phase.
  3. The actual pass-through to NZAS during the 2010 to 2012 period is likely to be significantly higher or lower than the average value above".

So it's not just a matter of reading the contract. There is also "related information" from New Zealand Aluminium Smelters Limited. There is also an "analysis". This "analysis" suggests that actual annual pass-through electricity costs vary from year to year and may be more or less than than the electricity allocation baseline. However, in spite of this variability, the average pass-through electricity costs for the years 2010 to 2012 is known (but has been deleted to keep it confidential) and is less than 0.52 tCO2-e/MWh.

Paragraph 9 of the Executive Summary states a fairly firm conclusion;

"Information obtained from New Zealand Aluminium Smelters Limited (NZAS) enables electricity pass-through costs that NZAS faces for 2010 to be determined with reasonable certainty at this point."

Paragraph 41 states; "to reflect the actual electricity costs to NZAS, the allocative baseline for NZAS would need to be amended at the beginning of 2011, 2012 and 2013 to ensure that final allocations more accurately reflect the pass-through of electricity costs to NZAS".

So, in conclusion, the Ministry for the Environment has set up a regulatory process where New Zealand Aluminium Smelters Limited is enabled and encouraged to annually provide the Ministry with "related information" and "analysis" of the electricity contract - in order to set the allocation baseline and therefore the number of free units they will be allocated. And this information analysis is not disclosed. It's hard not to conclude that this bespoke process allows New Zealand Aluminium Smelters to annually nominate it's preferred free allocation of emission units.

02 November 2012

I was alone the exporter had flown Norwegian Wood isn't it good

Geothermal Power Plant on Tasman Mill site, Kawerau NZ Norwegian wood and newsprint transnational Norske Skog Tasman (NZ) Ltd 'exports itself'. Mr February looks at the flight of another manufacturer and CO2 emitter and exporter as it lays off staff and reduces production. Wasn't the very generous free allocation of units in the New Zealand Emissions Trading Scheme meant to keep exporters like Norske Skog Tasman in New Zealand? Or have we just removed the price signal from exporters for no valid reason and stuffed the NZETS?

The other week Gareth tweeted about a good article in the Herald by Chris Barton.

Chris Barton reported that the Norwegian-owned newsprint-maker and transnational Norske Skog Tasman NZ had joined the ranks of export businesses like Rio Tinto Alcan NZ/NZ Aluminium Smelters who are exporting jobs off shore.

Norske Skog is shutting down one of two newsprint machines at the Tasman Mill, in Kawerau, due to lowered demand for newsprint.

At the same time Norske Skog is building a new $A84 million plant in Tasmania with some substantial help from the Australian Federal government (A$28 million grant) and State government (A$13 million loan).

Chris Barton noted some strong questions asked of the Government such as "what is being done for jobs"? And strong criticisms of the Government's naive "market will take care of everything" approach.

Chris Barton mentioned the NZ emissions trading scheme (NZETS) only briefly in passing, as he noted the rock-bottom NZ carbon price and the poor despairing carbon foresters.

So that prompted me to look at how Norske Skog Tasman NZ fits into the NZETS. What are the greenhouse gas emissions of the Norske Skog Tasman pulp mill? Is Norske Skog Tasman regulated by the NZETS? Have they ended up with a large free allocation of emission units (like NZ Aluminium Smelters Ltd) ostensibly to protect their international competitiveness and to keep the jobs in NZ?

Norske Skog Tasman uses geothermal steam from the Kawerau geothermal field for heating and electricity generation in its newsprint mill. Geothermal steam naturally contains carbon dioxide and methane which are released when the heat energy is transformed.

The use of geothermal steam for energy is covered by the NZETS as an energy sector emission. So Norske Skog Tasman must report its greenhouse gas emissions and obtain and surrender emissions units.

There is a specific emissions factor in the Climate Change (Stationary Energy and Industrial Processes) Regulations 2009 for Kauwerau's geothermal steam. The factor is 0.0275 tonnes CO2-2 per tonne of geothermal steam used.

Norske Skog Tasman's production of newsprint is included as an emissions-intensive trade-exposed activity eligible for a free allocation of 0.4911 emission units per tonne of uncoated newsprint, at the highest level of assistance; 90%.

So far, so much like NZ Aluminum Smelters/Rio Tinto Alcan NZ.

Let's start with a 'back of envelope' calculation of the units Norske Skog Tasman should surrender (the NZETS gross carbon price).

According to the Kawerau Geothermal Field Background Study, Mighty River Power supplies 285 tonnes of geothermal steam per hour to Norske Skog Tasman, who on-sell 26 tonnes to Carter Holt Harvey Wood Products. So net use is 259 tonnes per hour.

Assuming 24/7 production, the annual use is 259 * 24 * 365 = 2,268,840 tonnes of steam per annum. And 2,268,840 * 0.0275 = 62,393.1 tonnes CO2-e. So in a typical year, Norske Skog Tasman should be surrendering very roughly about 62,000 emission units under the NZETS.

How many free emission units were allocated to Norske Skog Tasman? In both 2010 and 2011, Norske Skog Tasman received the fifth largest free allocation of units (after the Smelter, NZ Steel, Methanex and Fletcher Concrete). In 2010, Norske Skog Tasman received 122,826 New Zealand Units (NZUs) for the six-month 2010 NZETS compliance period. In 2011 Norske Skog Tasman received 237,752 NZUs.

Assuming 24/7 production in 2011, Norske Skog Tasman was allocated 381% more units than it needed to surrender (237752/62393.1 * 100 = 381.0550). Thats a way more excessive free allocation than NZ Aluminium Smelters!

However, I might not have the right numbers. My calculation may be wrong. Why don't I ask the Environmental Protection Authority under the Official Information Act for the exact number of units surrendered by Norske Skog Tasman. Watch this space.

Alternatively lets look at Norske Skog Tasman's annual financial statements (PDF) for the 2011 calendar year.

Note 24 helpfully records that Norske Skog Tasman received 119,646 units in 2010 and 241,825 units in 2011. They surrendered only 10,754 units and sold 160,000 units, and had 190,717 units left at 31 December 2011.

The accounts show that in 2011 Norske Skog Tasman was allocated 22 times more units than it needed (241,825/10,754 = 22.49). The units allocated to protect jobs and export competitiveness, were not 90% of units surrendered. They were not 100% of units surrendered. The units allocated exceeded the units surrendered by a factor of 22!.

I can still here an echo of voice saying "You have left out the electricity allocation factor! You are wrong wrong wrong!" Well, yes, the industrial free allocation factor of 0.49 units per tonne of newsprint allegedly includes compensation for NZETS-related electricity price increases our manufacturing emitter is subject to. This rationale and the factor of 0.49 units per tonne were approved in this Cabinet paper. However, the cabinet paper provides no explanation of how the factor of 0.49 units per tonne of newsprint was calculated.

The electricity allocation factor has also been the subject of a consulation process and there is an emitters contact group for it as well.

However I think the idea that manufacturing emitters need compensation for NZETS-related electricity price increases is a smoke-screen. Norske Skog Tasman has not had its electricity price increased by the NZETS.

According to the Kawerau Geothermal Field Background Study (PDF), Norske Skog Tasman and Mighty River Power (MRP) have "..a power purchase agreement whereby NST (Norske Skog Tasman) contracted to take a majority of MRPs generation. Due to the fact that MRPs plant is grid tied, this is effectively a financial agreement offering NST price certainty and MRP a customer contracted to take the majority of supply."

The Tasman Mill is not just a plant connected to the grid. It was built to use geothermal power, just as Tiwai Point Smelter was built to use Lake Manapouri's hydro power. The Tasman Mill is joined at the hip to the Kawerau geothermal field. The newest Mighty River Kawerau geothermal generation plant was built on the Tasman Mill site. Norske Skog is buying geothermal steam from Mighty River Power and paying MRP as if it was electricity via a financial derivative contract.

To conclude the free allocation part of the analysis; in the example of Norske Skog Tasman, the NZETS free unit allocations are not just a discount of the full NZETS carbon price, the allocations are a transfer of substantial corporate welfare. The units allocated exceed the units they have to surrender by an estimated factor of 22.

And in terms of protecting the international competitiveness of Norske Skog Tasman and keeping jobs in New Zealand, the free allocations have not made the slightest difference. Thats in spite of National Party scaremongering back in 2008 that the NZETS would cause the mill to close. And Catherine Beard of Business New Zealand (formerly boss of the Greenhouse Policy Coalition) still scaremongering in October 2012 that any real cap in the NZETS will cause more job losses Talk about slamming the stable door after the horse has bolted.

Lets look at the real factors affecting whether a commodity manufacturer stays in New Zealand.

If you are a transnational like Norske Skog, you always have the choice of playing off more than one jurisdiction. The country with the smaller economy, like New Zealand, can't match the money of a larger economy like Australia. If Norske Skog had not purchased the Tasman Mill from Fletcher Challenge in 2000, this 'regulatory arbitrage' would not be possible.

Corporate aquisitions that seemed a good idea before the Global Financial Crisis, look much more risky after the Global Financial Crisis. Norske Skog paid $NZ5 billion for Fletcher Challenge's paper and pulp assets. In 2011, Norske Skog was faced with falling international demand and prices and it was considering selling some assets to avoid default on its debt.

Incidentally, Rio Tinto Alcan shares most of these international commodity trader issues; the over-priced debt-funded purchase of Alcan and Comalco by Rio Tinto before the GFC, the Rio Tinto's plan to sell Pacific Aluminium (including NZ Aluminium Smelters Ltd), the low demand for aluminium from the stagnant economies of the Eurozone and the USA and the price and supply competition from Chinese smelters in the huge and growing Chinese market.

Imagine a fictional conversation between John Key and the CEO of Norske Skog.

"So, Yon, you don't mind if I call you Yon? For the Tasman Mill, you kiwis are all online, the demand for newsprint is down. You give me quarter of million of these NZ units that are worth $NZ3 each. No other ETS accepts them. Thats pretty low quality carbon credit, Yon. Now, Yulia Gillard, she gives us $A28 million for new plant at the Boyer mill in Tasmania. Can you match that, Yon? Can you?"

That is the bottom-line, isn't it? New Zealand could never have matched $A28 million, either as a direct grant, or through manipulation of the NZETS free allocation provisions.

To me, the Norske Skog Tasman job losses are a good demonstration of how futile it was to have an NZETS designed mainly to completely avoid any carbon price on transnational exporters. The carbon price has not just been reduced or discounted to Norske Skog, the sign has been reversed so that its an off-balance sheet transfer of corporate welfare to them in the form of emission units. Such transfers are no doubt sought by local managers who are rent-seeking, but they will be irrelevant to the international commodity trade movements that will ultimately determine whether these transnationals stay or go.

11 September 2012

New Zealand Aluminium Smelter Ltd do a Godfather; Nice smelter you got. Be a shame if something happened to it

The Godfather Robin Johnson's Economics Web Page argues that Rio Tinto-owned New Zealand Aluminium Smelters Ltd, the owner of the Tiwai Point aluminium smelter, is "Godfathering" the smelter, its workforce, the Southland economy, the NZ electricity market, Meridan Energy and the poor critically endangered slow-breeding kakapo, as well as "Godfathering" the NZ emissions trading scheme to get excessive free allocations of emissions units.

I have invented a new term for climate change blogging.

Godfathering!

Its a bit like Grandfathering, which is a bit of jargon from emissions trading. But different. Grandfathering in an emissions trading scheme (an ETS), is giving the emission units for free to the existing emitters in the ETS on a historic pro-rata calculation.

The units of course representing the desired cap on emissions. Alternatively the units could be sold by auction to emitters which is logical if we treat the units as shares in a public commons owned by the Government on behalf of citizens.

Of course our NZETS is not so simple. If our NZETS just applied simple "grandfathering" as outlined, then it would have a real cap, it would not allow importing of unlimited international units, and it would be impossible for any emitter to receive more units than their emissions.

Thats not the case under the NZETS, at least for some emitters. In 2010, the Rio Tinto Alcan subsidiary NZ Aluminium Smelters Ltd, which is roughly New Zealand's third largest point source of greenhouse gas emissions, was a net seller of units, not a net payer. Their free allocation of units was 135% more than the units they needed to surrender for their emissions.

That's excessive. The justification given for this is that in order to maintain their export competitiveness, NZ Aluminium Smelters Ltd needed to be compensated for the rather unfathomable and diluted ETS costs that may flow through their secret contract with Meridian Energy and the electricity wholesale market. I will come back to this later in the post.

Let me update the smelter emissions and unit allocations for the 2011 year.

In 2011, NZ Aluminium Smelter Limited produced 354,030 saleable tonnes of aluminium. The 2011 Ministry of Economic Development Chief Executive's Report shows that the New Zealand aluminium manufacturing sector (a.k.a. NZ Aluminium Smelter Ltd) reported emissions of 601,370 tonnes CO2-e for the 2011 year. We divide by two for the 'two tonnes for one unit' deal, and that results in 300,685 units to surrender.

The NZ Ministry for the Environment allocated 437,681 units to NZ Aluminium Smelter Ltd for the 2011 calendar year.

That's 136,996 more units allocated than surrendered or alternatively the units allocated to NZ Aluminium Smelter Ltd exceeded the units surrendered by 146%.

So that's even more excessive than 2010's 135% over-allocation!

How did NZ Aluminium Smelter Ltd/Rio Tinto Alcan NZ Ltd achieve that? Simple really. They threatened to close the smelter and move production offshore if the NZETS really imposed a real carbon price on them.

"Thats a nice aluminium smelter you got. Be a shame if something happened to it."

Now thats what I call "Godfathering"! But wait there is more.

In July, NZ Aluminium Smelters announced an annual loss.

The smelter CEO Ryan Cavanagh said the smelter's financial difficulties were due to falling world aluminium prices. And that they needed to revise their electricity supply contract with Meridian Energy to get input costs down.

A day later, the parent company Rio Tinto Alcan indicated what may happen to it's unprofitable smelters. They will be shut down. No pressure, Meridian Energy!

"Thats a nice aluminium smelter you got. Be a shame if something happened to it."

According to New Zealand Herald economics editor Brian Fallow, if the smelter closes, there could be a "seismic" knock-on effect on the electricity market. Supply would exceed demand by the 14% of New Zealand's electricity generation used by the smelter. Wholesale electricity prices would react. Some generation assets might be crowded out.

"Thats a nice wholesale electricity market you got. Be a shame if something happened to it."

Brian Fallow notes the electricity contract with Meridian Energy, that the smelter wishes to renegotiate, represents 40% of Meridian's sales. Closure of the smelter or renegotiation of the contract put the spanner of uncertainty into the Government's planned partial sale of Meridian and the other generators.

"Nice plan for partial privatising some state-owned power generators you got. Shame if something happened to it."

The closure of the smelter would also have an impact on the local Invercargill and Southland regional economy.

"Nice regional economy you got. Shame if something happened to it."

Next we hear that the smelter is fast-tracking the redundancies of it's highly-trained and highly-paid workforce.

"Nice well-trained professional smelter labour force you got. Shame if something happened to it."

Strigops_habroptilusAnd NZ Aluminium Smelter also wants to withdraw from partly funding the successful Kakapo Recovery Programme.
"Nice charismatic endangered species programme you got. Shame if something happened to it."

That's a lot of Godfathering!

Let's look at New Zealand Aluminium Smelter's electricity use and costs in 2011. How much do they use? How much do they pay? Does their power cost justify extra allocations of emissions units? Is it realistic for New Zealand Aluminium Smelter to try to get Meridian Energy to give them cheaper power?

New Zealand electricity use data is available from the Energy Data File 2012. The specific data is Spreadsheet G worksheet G.6.a. now at stored Google Docs.

Electricity use by sector 2011

This dotchart is of electricity use data from the sheet G worksheet G.6.a.

The chart makes it very clear that the Tiwai Point Smelter is, by a huge margin, the biggest single consumer of electricity in New Zealand. A single company at a single plant used 5.3 million MWh out of 38.8 million MWh consumed in 2011, or 13.67% of the total consumption. Only the combined 4.4 million people in homes (the residential sector) used more, with 13 million MWh or 33% of the total. If we just look at industrial use of electricity, and leave out the residential sector, the smelter uses 20.6% of all electricity used by industry.

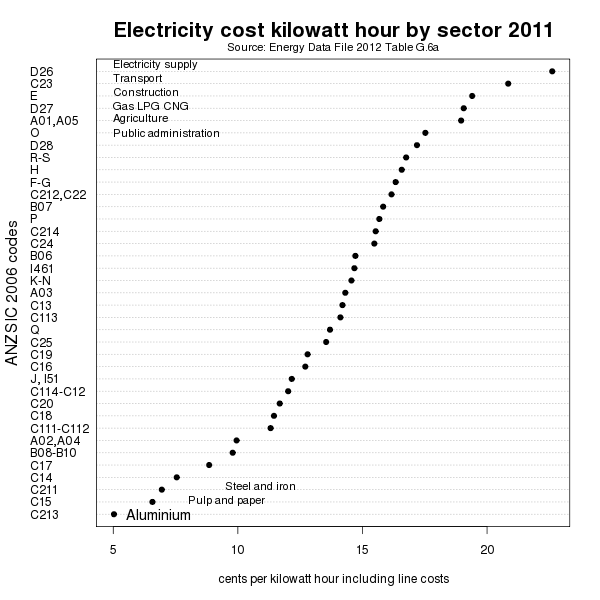
Electricity sales price by sector 2011

This chart shows industrial electricity sectors sorted by average rate (including line costs) in cents per kilowatt hour (i.e. its MWh divided by sales $$ times 100). You need to look at the bottom left hand corner for aluminium smelting, not the top. Thats because NZ Aluminium Smelter Ltd pays the very lowest average rate for electricity in New Zealand; 5.03 cents! Residential users pay 22.6 cents per KWh, or four times as much.

No industry in New Zealand uses more electricity than New Zealand Aluminium Smelters. No industry pays less per unit for electricity than they do. They even get excessively allocated emissions units to help with the lowest priced power contract in New Zealand. And now New Zealand Aluminium Smelters are going for "Godfather" gold by trying to bully their power price even lower.

28 October 2011

Sorry Nick its not the only aluminium smelter facing a carbon price and free allocation is an expense

What does The Hon Dr Nick Smith, Minister for Climate Change Issues, say when the Greens accuse him of subsidising greenhouse gas polluters. Well it seems he denies it and he produces instructive soundbites of spin. I am informed that at Wellington's Oxfam election and climate change debate he said that the NZ Aluminium Smelter Ltd's operation at Tiwai Point is the only aluminium smelter in the world exposed to a carbon price.

He has said this soundbite a few times. For example, in response to Kennedy Graham on 29 September 2011:
"..the aluminium smelter in Bluff is the only aluminium smelter in the world to face any price at all for its greenhouse gas emissions".
On TV One's 'Q and A' programme:
"the New Zealand Aluminium Smelter in Bluff, it is the only one in the world that pays any face at all for carbon pricing." (1)
In Parliament in September 2009,
"...the Bluff smelter, on 1 July next year, will be the very first to face a carbon price for its pollution. The European scheme excludes aluminium smelters until 2013..."
Does Dr Nick's soundbite stand up to scrutiny? The European Union Emissions Trading Scheme, which started in 2005, excludes the European aluminium smelters until 2013. But it included electricity generation from 2005. And aluminium smelting is very electricity intensive. As the International Energy Agency says: "Although the primary aluminium sector is not directly covered by the (EU) ETS, the impacts of the CO2 price are felt through increases in electricity prices" (p 8). (2)

Another example of a Smith soundbite is saying that the overly-generous free allocation of emissions units to industry in the NZETS is not a cost to the taxpayer. For example: Parliament on 29 September 2011:
"This member and other members make the gross error of trying to claim that not exposing industries or consumers to the full price of carbon over all their emissions is somehow a subsidy. A subsidy implies that there is a cost to taxpayers. That is not true.."
Unfortunately for Dr Nick, that's not what the Auditor General, Lynn Provost, says in her accounting and auditing advice for emissions units in the public sector
"NZUs have a market value and the issue of NZUs without charge to participants is an expense to the Government and creates a liability".
Sorry Dr Smith, the Tiwai Point smelter is not the only aluminium smelter exposed to a carbon price in an ETS. And the European smelters probably pay a higher carbon price through their electricity costs as the Tiwai Point smelter owner is compensated for electricity costs as well as emissions through excessive free allocation of emissions units.

Sorry Dr Smith, you can't just create and give away a permit to emit greenhouse gases that has a clear market value and say there is no cost to taxpayers as Treasury did not write out a cheque. The Auditor General says there is a cost to taxpayers of giving emissions units away to emitters.

Footnotes
(1) NB By 'pay any face' I think he means 'face any price'.)
(2) IEA, 2008,'Climate Policy and Carbon Leakage - Impacts of the European Emissions Trading Scheme on Aluminium'

19 October 2011

120% Pure Subsidy NZ Aluminium Smelters Limited Part 2

I have had some very good comments on the 120% Pure Subsidy post about the quantity of free emissions units that NZ Aluminium Smelters Limited (NZAS) has received under the NZ ETS in 2010. Enough good comments that they justify a second post on NZ Aluminium Smelters free units.

Simon Terry of the Sustainability Council points out that we shouldn't be surprised at the high level of free allocation of units to big emitters. Simon Terry documented this in June 2008, in the report Corporate Welfare Under the ETS, which looked at free allocation of units to eight energy intensive companies under the proposed NZ ETS.

In particular, Simon Terry reminds us that in the NZ ETS the free allocation of units includes a factor to compensate for NZ ETS related electricity price increases. As the NZ ETS will make some power generation more expensive to the extent that it uses fossil fuels (Huntly Power Station for example). This explains why the 'allocative baseline' factor for aluminium smelting is 2.645 units per tonne aluminium when the emissions factor for the MfE Greenhouse Gas inventory is 1.67 tonnes CO2-e per tonne aluminium.

This feature of using free allocation of units to compensate emitters for electricity price increases is explicit in the Labour Government's original NZ ETS proposal Framework for a New Zealand Emissions Trading Scheme, released in September 2007. As indicated by this quote under the heading "Allocation of emission units"
"indirect emissions associated with the consumption of electricity, as well as direct emissions from ... industrial processes will be included in the concept of emissions from industrial producers...The basis for allocation for electricity consumption will be one that compensates firms for the cost impact".

Another regular commenter, Password1, says my analysis is totally incorrect because I have left out the indirect emissions from using electricity, that I not comparing the same sets of data, and that I need to redo my calculations based on what is in the legislation. Further, my assertion that there has been an "overallocation" of units "is wrong, wrong, wrong".

Password1 concludes that
"The smelter is not getting a ‘refund’ – they are facing a proportion of the full cost of emissions both at the point of aluminium production and from being passed down from the electricity generator."

Okay maybe I will redo my calculations. So off I will go down the rabbit-hole and look into this electricity factor. So what is the proportion of the 'allocative baseline' factor for aluminium smelting, 2.645 units per tonne of aluminium, is to compensate for NZ ETS-related electricity price increases?

This idea of fossil-fuel-thermal power costs (increased by the NZ ETS) affecting a smelter that only exists because of hydroelectric dams on Lakes Manapouri and Te Anau seems a bit bizarre. Especially since NZAS's supply contract is with Meridian Energy, the 100% renewable power company.

However, the wholesale electricity market works by preferentially using the lowest priced generation offer in any one half-hour trading period. Brian Fallow points out that this means that wholesale price is set by the most expensive block of electricity offered into the market which is needed to ensure demand is satisfied and that block may be from Genesis Energy's Huntly coal and gas thermal plant.

When demand is high and hydro lakes are low, thermal power sets the wholesale price. As was the case through much of 2008. When demand is low and hydro lakes are full, then the Huntly Power Plant may be on the substitutes bench and the NZETS costs won't flow through to the wholesale electricity price.

So it does seem that there is some level of carbon price from the NZ ETS reflected through the wholesale price that ends up in the electricity price paid by NZAS. However, it is quite hard to quantify this price.

Allocative baselines are discussed in June 2010 in this Cabinet paper. Paragraph 37 tells us that the electricity allocation factor is 0.52 tCO2-e/MWh. Paragraph 40 tells us that an analysis of NZAS's electricity contract with Meridian Energy indicates that the use of this factor would result in over-allocation of units as the actual extra electricity costs are less than 0.52 tCO2-e/MWh.

Unfortunately the actual extra electricity costs, the degree of over-allocation and the fiscal cost of allocation to NZAS, have all been blanked out from the cabinet paper, apparently as 'the information is commercially sensitive'. I appear to be at the end of that rabbit-hole.

The next rabbit-hole is to check the emissions factor that gives CO2-e from tonnes of aluminium produced.

In terms of emissions reported and units surrendered, Regulation 35 of Climate Change (Stationary Energy and Industrial Processes) Regulations gives a 10-variable formula for the smelter's aluminium emissions factor. I am missing about 4 of these variables. So thats also a dead end for duplicating the emissions and the units to be surrendered.

But why don't I just use actual numbers? The Ministry of Economic Development Chief Executive's Report shows that the NZ aluminium manufacturing sector has only one NZ ETS 'participant' and that the sector, and therefore the one participant, NZAS, reported emissions of 615,814 tonnes CO2-e for the 2010 year and 312,294 tonnes CO2-e for the six months from 1 July to 31 December 2010.

So 312,294 tonnes were emitted in the six month period of obligation to surrender matching units. So we divide by 2 for the two-for-one unit deal, and that results in 156,147 units to surrender.

210,421 units were allocated to NZAS for the six months according to the Ministry for the Environment.

That's 54,274 more units allocated than surrendered or alternatively the units allocated to NZAS exceeded the units surrendered by NZAS by 135%.

This result is pretty much a mid-point between my previous estimates which were from 147% to 122%, as summarised in this table.
Table 1 Low actual and high estimate of units to surrender
LowActualHigh
Units to surrender143,342156,147172,526
Units allocated210,421210,421210,421
Excess allocation (units)67,07954,24737,896
Excess allocation (per cent)147%135%122%


Summing up

  1. NZAS was allocated 210,421 emission units in the six-month NZ ETS compliance period in 2010. Without any reasonable doubt, this represents 54,274 more emission units than it surrendered to match emissions.

  2. At today's NZ unit price of $14, the value of the units allocated is $2,945,894. The value of the excess of units allocated above units surrendered is $759,836.

  3. An unknown (or undisclosed) proportion of the free units are intended to compensate NZAS for NZ ETS-related electricity price increases in a year characterised by highest level ever of renewable generation.

  4. I can't prove that the amount of free units allocated is more than the sum of the units to be surrendered for emissions plus some units as compensation for electricity price increases. But I think it is highly likely.

  5. In any case, it hardly matters whether the volume of free allocation is either just under 100% of costs or whether its 135%. Both options pretty much effectively negate the carbon price and mean no real incentive to reduce emissions.


The bottomline for me is that if NZAS were not in the NZ ETS, they would at least be paying the some carbon price as a 'downstream' electricity user where some costs of fossil-thermal power generation are factored into the wholesale electricity price when fossil-thermal power is not priced out by cheaper hydro-generation.

Under the current policy settings, the smelter would face a higher carbon price if it were exempted from the NZETS.

05 October 2011

150% Pure Subsidy - Industrial allocation of free emissions units to Rio Tinto Alcan NZ

Last week, (back on 29 September 2011 actually), Green MP Kennedy Graham was questioning Climate Change Issues Minister Nick Smith over his apparent lack of consistence over subsidies for fossil fuel industries.

Kennedy Graham was wondering why Nick Smith and Climate Change and Trade Negotiations Minister Tim Groser were happy on the one hand to oppose billion dollar subsidies to fossil fuel industries on the international stage, while on the other hand have the New Zealand Emissions Trading Scheme include subsidies in the form of generous free allocation of emissions units to big industrial emitters of GHGs.

The Hon Dr Nick Smith replied:
"...this Government is not providing subsidies to greenhouse gas polluters. I remind the member that we are the only country outside the EU to have an emissions trading scheme. Our aluminium smelter in Bluff is the only aluminium smelter in the world to face any price at all for its greenhouse gas emissions".
Lets examine this assertion in two parts; that the Tiwai Point Aluminum Smelter, receives no subsidies from Government and it faces a carbon/GHG price.

A brief recap, Tiwai Point Aluminum Smelter at Bluff, out on the edge of Foveaux Strait near Invercargill, is operated by NZ Aluminium Smelters Limited, which in turn is owned by Rio Tinto Alcan NZ Limited, a subsidiary of Canadian multinational Rio Tinto Alcan.


NZ Aluminium Smelters Limited has received an allocation of free emissions units under the NZ ETS. That is clear from that un-labelled pie chart I have been banging on about. The chart shows that iron, steel and aluminium production are to receive 40% of all free industrial allocation of emissions units.

However, we don't need to do any guessing as the Ministry for the Environment has just released an analysis of how many free emissions units were allocated to whom under industrial allocation for the half-year compliance period 1 July to 31 December 2010.

NZ Aluminium Smelters Limited received 210,421 NZ emissions units or 12% of the total allocated of 1.77 million units. By the way, only New Zealand Steel, the operator of the Glenbrook Steel Mill, received more units. They got 494,704 units.

How does this allocation of free emissions units compare with the number of emissions units that would need to be surrendered? Is the allocation more or less than the number of units surrendered?

With a bit of ferreting, I have found enough data to make some back-of-envelope-but-on spreadsheet calculations. Here are the inputs and constraints I used.
  1. 2010 production of aluminium: 343,335 tonnes. From 2010 Sustainability Report , NZ Aluminium Smelters Limited.

  2. Emissions factor for aluminium: Low estimate . 1.67 tonnes CO2-e per tonne Aluminium. From Ministry for the Environment's New Zealand’s Greenhouse Gas Inventory 1990–2009.

  3. Emissions factor for aluminium: High estimate. 2.01 tonnes CO2-e per tonne Aluminium. From Heavy Industry Energy Demand Update Report Prepared for Ministry of Economic Development February 2009, Covec Ltd.

  4. The compliance period for surrendering units is from 1 July 2010 to 31 December 2010, a half-year.

  5. The obligation to surrender units is a half obligation because of the two units for one tonne of GHGs deal.

  6. Free allocation of units is also reduced by a half.

  7. Free allocation is calculated as 90 per cent of the allocative baseline (a benchmark number of NZUs per unit output)

  8. The aluminium allocative baseline is 2.645 units per tonne of aluminium produced. From Section 7 of the Climate Change (Eligible Industrial Activities) Regulations 2010
I will first check my input assumptions by calculating my own estimate of the actual units allocated; 210,421.

Table 1. Estimate of emissions units allocated
2010 production tonnes Aluminium    343,335
Half year production /2 (1 July 31 Dec 2010)171,668
Half obligation /2 (one unit/2 tonnes)85,834
90% emissions-intensive-trade-exposed allocation 77,250
Allocation baseline (tCO2-e/t output)2.645
Equals estimate of Units allocated204,327
Difference (approx. 2.9%)6,094
Actual Units allocated210,421

My estimate of units allocated is 204,327, which is only 6,000 odd units (or 2.9%) less than the actual units allocated of 210,421. So it seems my inputs are roughly good enough.

Table 2 High and low estimate of units to surrender
2010 production tonnes Al    343,335     343,335
MfE Emissions factor (t Al/t CO2-e)1.672.01
Estimated emissions 2010 t CO2-e573,369690,103
Half year compliance period (1 July 31 Dec 2010 /2) 286,685345,052
Half obligation (one unit 2 tonnes /2)143,342172,526
Estimated Units to surrender143,342172,526
Actual Units allocated210,421210,421
Excess allocation (units)67,07937,896
Excess allocation (per cent)147%122%

Nick Smith implies that the free allocations reduce but do not remove the exposure to the carbon price. This is simply not correct. If it was correct, units allocated to NZ Aluminum Smelters would be less than units surrendered. However, units allocated exceed my estimates of units needed for surrenders.

I estimate that NZ Aluminium Smelters Limited were required to surrender between 143,000 and 172,000 emissions units for the six months to 31 December 2010. NZ Aluminium Smelters Limited were given, under 'industrial allocation', 210,421 units. My low and high estimates of the units to be surrendered exceed the actual units allocated by 37,000 and 67,000 units respectively.

Nick Smith says emitters are not being subsidised by free allocation. This too is simply not correct. Allocations greater than surrenders equals over-allocation or a net gain to NZ Aluminium Smelters Limited. The estimated over-allocation is from 124% to 147%. NZ Aluminium Smelters do not face a positive carbon price at all. If the NZ ETS was a carbon tax, NZ Aluminium Smelters would have a negative carbon tax rate!

This perverse outcome is exactly why carbon taxes are in practice simpler, more effective, and a more robust way of carbon pricing than emissions trading.